Mixing Testing and Logging for a Better Developer Experience
People love a great article about a new programming paradigm/vision/motto which change the way you architect/develop/maintain your system. This is not one of those articles. I am gonna talk about the stupid daily life of a programmer - and the problems you don’t hear so much about because they seem so dull and obvious: getting the right feedback through logs and tests.
Getting the Right Feedback with Logging
What to do with logging? A log is a trace of events, which allows one to reconstruct what has happened. Good practices tell you to have events at different levels of granularity. I especially like the ones from bunyan on this topic. Shameless copy-paste from the doc:
« fatal »: The service/app is going to stop or become unusable now. An operator should definitely look into this soon.
« error »: Fatal for a particular request, but the service/app continues servicing other requests. An operator should look at this soon(ish). « warn »: A note on something that should probably be looked at by an operator eventually.
« info »: Detail on regular operation.
« debug »: Anything else, i.e. too verbose to be included in « info » level.
« trace »: Logging from external libraries used by your app or very detailed application logging.
While developing my system, I might use log events to:
- validate its behavior: do I get a consistent trace, with events as expected?
- explore how it behaves when running an edge case
- diagnose what leads to an unexpected behavior
But depending on the case, I want different levels of details about the behavior of my system. The default one is « info », since it traces all regular operations. It should be good enough when validating or exploring the system - with the occasional look at debug level when one wants to check finer details. Meanwhile, when debugging, I might run anywhere between the error level (because there is too much noise otherwise) and the debug or trace level (because I want maximum details about what led to this bad behavior).
The important ability here is filtering events, either through a predefined level (all events below being discarded) or, even more interestingly, through a post-mortem filter which takes the full trace but only outputs the chosen events.
Let’s take a look at bunyan again. I can configure a stream to output events at or above a level given by the LOGLEVEL environment variable.
bunyan.createLogger({
    name: 'myApp',
    level: process.env.LOGLEVEL
  })

$ LOGLEVEL=info npm start

13:49:45.726Z  INFO mw: Server listening on http://:::3000
13:49:47.163Z  INFO mw: Handler send requestStatus (context=printers, message={"command":"requestStatus"})
13:49:47.171Z  WARN mw: PrintingStopped - Item marked in error (context=printers)
13:50:21.910Z  INFO mw: GET /printers -> Status 200 (context=restApp)
13:50:35.349Z ERROR mw: Can not get, Id unknown 10 (context=restApp)
    Error: Can not get, Id unknown 10
13:50:35.351Z  WARN mw: GET /productions/10 -> Status 404 (context=restApp)
Or I can use the bunyan CLI to filter log output on the command line.
$ npm start | bunyan --level warn

13:49:47.171Z  WARN mw: PrintingStopped - Item marked in error (context=printers)
13:50:35.349Z ERROR mw: Can not get, Id unknown 10 (context=restApp)
    Error: Can not get, Id unknown 10
13:50:35.351Z  WARN mw: GET /productions/10 -> Status 404 (context=restApp)
Pretty easy right?
On larger systems, I also like to add some context data to each event - basically where it does come from. It allows one to filter by context when consuming the log. Maybe you only want log events from some parts of the system, or you do not want those events from a noisy module which has no relation to your current concern.
Again, one can use the bunyan CLI to filter log output on the fly.
const log = bunyanLogger.child({
    context: 'restApp'
  });

$ npm start | bunyan --condition 'this.context == "restApp"'

13:50:21.910Z  INFO mw: GET /printers -> Status 200 (context=restApp)
13:50:35.349Z ERROR mw: Can not get, Id unknown 10 (context=restApp)
    Error: Can not get, Id unknown 10
13:50:35.351Z  WARN mw: GET /productions/10 -> Status 404 (context=restApp)
In any case, partitioning your log output to ease filtering is a good idea. I like the approach of node debug (although, as its name implies, I would keep it for debugging purpose).
const debug = require('debug')('restApp')

  debug('GET %s', route)

$ DEBUG=restApp npm start
restApp GET /printers
That was rather down-to-earth. Notice I did not discuss where to put the log, how to rotate files etc. This is not your app concern: it should just dump events on standard output and let the infrastructure manages it. This, however, can have some impact on our next practice - testing.
Getting the Right Feedback with Automated Tests?
This is actually quite a hard topic. I will not discuss here the way to design your tests, how they should be independent (or not), how to have good failure messages… I will simply focus on how I use the test report in my console, and how it interacts with log output.
Sometimes I just want a basic feedback from my tests, something like a GREEN/RED status, because I am performing an health check, or refactoring my code. Let’s try to run some tests naively, with logger default settings.
$ npm test
Started
....{"level":30,"msg":"Handler register printer abcd-1234","time":"2016-03-30T15:45:44.881Z","v":0}
.{"level":40,"msg":"Handler: no UUID found in printer message { content: 'invalid' }","time":"2016-03-30T15:45:44.896Z","v":0}
{"level":40,"msg":"Handler: unknown message from printer { content: 'invalid' }","time":"2016-03-30T15:45:44.897Z","v":0}
.{"level":30,"msg":"Handler register printer abcd-1234","time":"2016-03-30T15:45:44.899Z","v":0}
{"level":30,"msg":"Item started 10777bfa-fe9f-477a-874c-abfa89a3dbee","time":"2016-03-30T15:45:44.899Z","v":0}
.{"level":30,"msg":"Handler register printer abcd-1234","time":"2016-03-30T15:45:44.901Z","v":0}
{"level":30,"msg":"Item progress 01cae871-3531-440f-bab9-e26d2042fa7e, 60","time":"2016-03-30T15:45:44.901Z","v":0}
// CUT FOR BREVITY: 68 lines of log output
.{"context":"restApp","level":30,"msg":"GET /productions/10 -> Status 200","time":"2016-03-30T15:45:45.188Z","v":0}
.{"context":"restApp","level":30,"msg":"POST /models/upload -> Status 204","time":"2016-03-30T15:45:45.215Z","v":0}
.
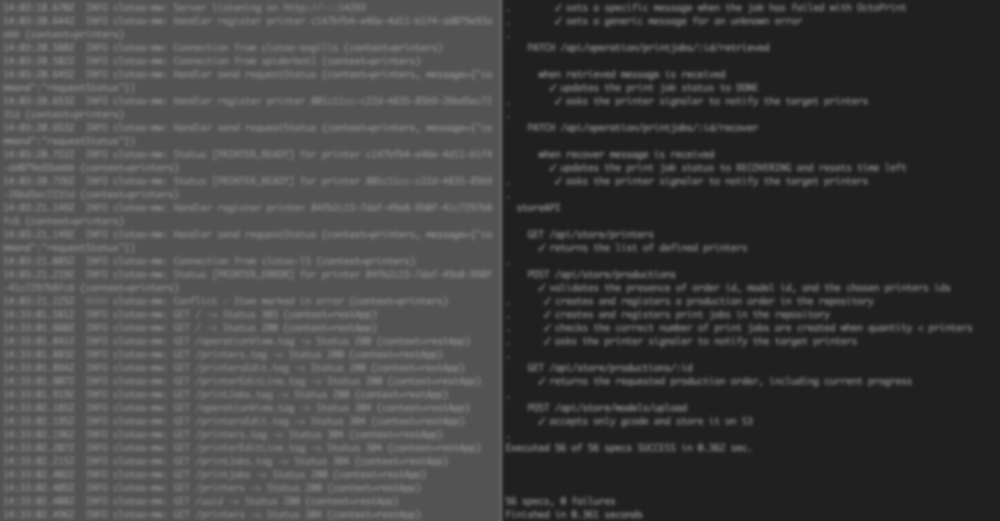
52 specs, 0 failures
Finished in 0.347 secondsFor 52 specifications, I got 68 lines of output, mostly logs, which I don’t really care about right now. Given my [tests are fast][3], I also would like to run them in watch mode. This would have the further inconvenience to flood my console with log output whenever I save a file and the tests run.
Now let’s say I can omit all log outputs.
$ npm test

Started
....................................................


52 specs, 0 failures
Finished in 0.26 seconds
Nice and clear message: all is right on the front line. This is much better, and I can now use my watch mode to run tests continuously, without the noise of log output. Having a lean test report is also beneficial when you run into problems. When a test fails unexpectedly, I want to have the failure and the stack trace right in front fo my eyes, not having to scroll up pages and pages of logs.
We could easily jump to the conclusion a null logger is the perfect tool to use in tests - one which redirects all output to/dev/null.
const nullLogger = bunyan.createLogger({
    name: 'nullLogger',
    streams: [{
      path: '/dev/null'
    }]
  })
  // inject nullLogger in your modules while testing
Customizing the Log Level for Tests
However, there may be good reasons to not discard all outputs while running your tests. Sometimes the stack trace is not enough and you want more data about the current run from, guess what, the log.
You might argue that your IDE formats test results for you, already filtering log noise. Yet there is still some cases where you want to look at the log produced by a test - debugging is one such case.
The second reason is that you might have an error handler in your system: it could log the error then recover the bad case. With a null logger, the error would be swallowed and you will never get to see it in your test report. This can easily lead to head scratching or debugging nightmare as you have a failing test without the most basic cue that something went wrong somewhere in your system.
try {
    // something may throw an Error
  } catch(e) {
    // log the error and recover
    log.error(e) // error redirected to /dev/null !
  }
This gives us two use cases for which we want to use log events in tests. The solution looks rather obvious. I should be able to customize the log level for my tests, so that I can get more details if need be. And by default, I only want errors to appear in my test log. This way, my test report is not disturbed by log events, unless something bad happens.
const testLogger = bunyan.createLogger({
    name: 'testLogger',
    level: (process.env.LOGLEVEL || 'error')
  })
  // inject testLogger in your modules while testing
In other words, by default, log events should equate test failures.
$ npm test

Started
....{"name":"testLogger","level":50,"err":{"name":"SyntaxError","message":"Unexpected token u","time":"2016-03-30T17:15:56.173Z","v":0}
F...............................................

Failures:
1) PrinterHandler: When a message is received, registers itself as handler
  Message:
    Expected undefined to be PrinterHandler.

52 specs, 1 failure
Finished in 0.267 seconds
npm ERR! Test failed.  See above for more details.
In the above example, my test fails on its assertion. But the root cause can easily be inferred from the error log screaming « Syntax Error ».
A Last Small Refinement
To cover our codebase, we could have a test case for error handling, checking that the error is recovered. Let’s take the following sample and its accompanying test.
function resilientParse(body)
    try {
      return JSON.parse(body)
    } catch (e) {
      log.error(e)
      return {}
    }
  }

  it('ignores non-json message', () => {
    expect(() => {
      resilientParse('not a JSON string')
    }).not.toThrowError(SyntaxError)
  });
Then running the test would produce an error output in the log. However, since the error is expected, having this output in our test report is not in line with « log events should equate test failures ». Why not silence the logger for this case?
it('ignores non-json message', () => {
    expect(() => {
      let lvl = testLogger.level()
      testLogger.level('fatal') // silence error logging
      resilientParse('not a JSON string')
      testLogger.level(lvl)
    }).not.toThrowError(SyntaxError)
  })
Final Guidelines
What to keep of this stuff? Just follow those basic principles next time.
- Do log your system events and use log levels accordingly.
- Make the log level customizable (through environment or other means). When debugging the system or the tests, you might want to temporarily increase or decrease the volume of information.
- Use a logger with a default level of error in your tests: you won’t be drowned/annoyed by the regular logs, but you will still get the right feedback when some unexpected error happens.
- If you write tests for error cases, you might want to temporarily disable logging. This way you do not get the false signal that something is wrong because an error log flashed in your test report.